What stood out?
 amonhen.helmfi.ai
Open chart at full size ↗
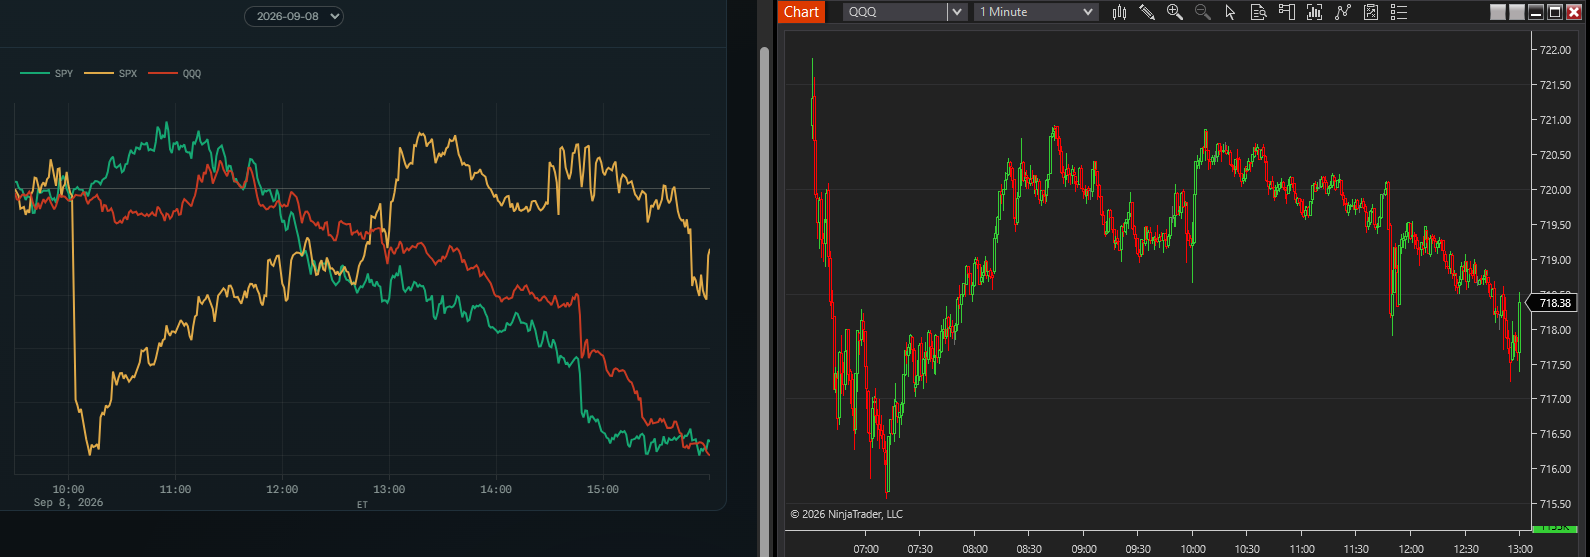
SPX call CVD dropped sharply shortly after 10:00 ET while SPY and QQQ flow remained much steadier. Split shows that calls created most of the move.
The call line reached roughly −17,000. That is a cumulative difference between classified ask-side and bid-side trades, rather than total option volume.
What happened next?
Open chart at full size ↗
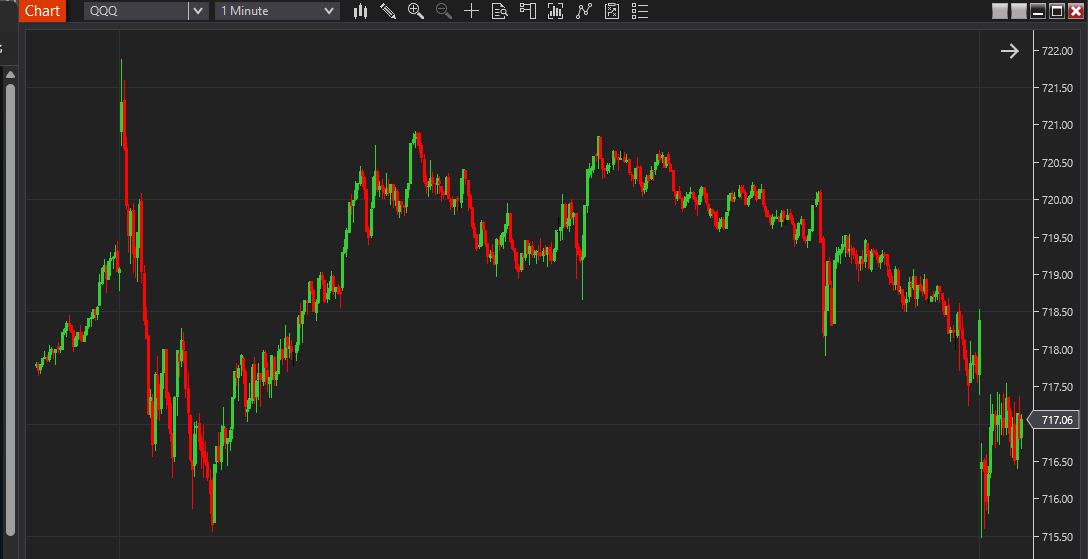
QQQ made its morning low during the sharp SPX move and then recovered by about five points. The other indexes did not follow SPX flow lower in the same way.
That sequence makes the event interesting: one options market showed an extreme move while the broader price response began to stabilize.
Why was it interesting?
A sharp move in SPX call flow may sometimes mark exhaustion, especially when SPY and QQQ are not confirming it. QQQ may offer a clean way to follow the broader market response.
The size and speed of the divergence matter more than the final CVD number by itself.
What should we watch next time?
Keep an eye on moves around 5,000, 10,000 and 15,000 contracts so we can learn which ones are large enough to matter. Also watch how quickly the move happens and whether the other indexes confirm it.
The best candidates may be the sessions where SPX flow reaches an extreme, begins to level out and QQQ or SPY remains firm. We also need to save the examples that keep moving instead of reversing.
Educational information only. Trading involves risk. Read the full disclaimer.