First, two different uses of “delta”
 amonhen.helmfi.ai
Open chart at full size ↗
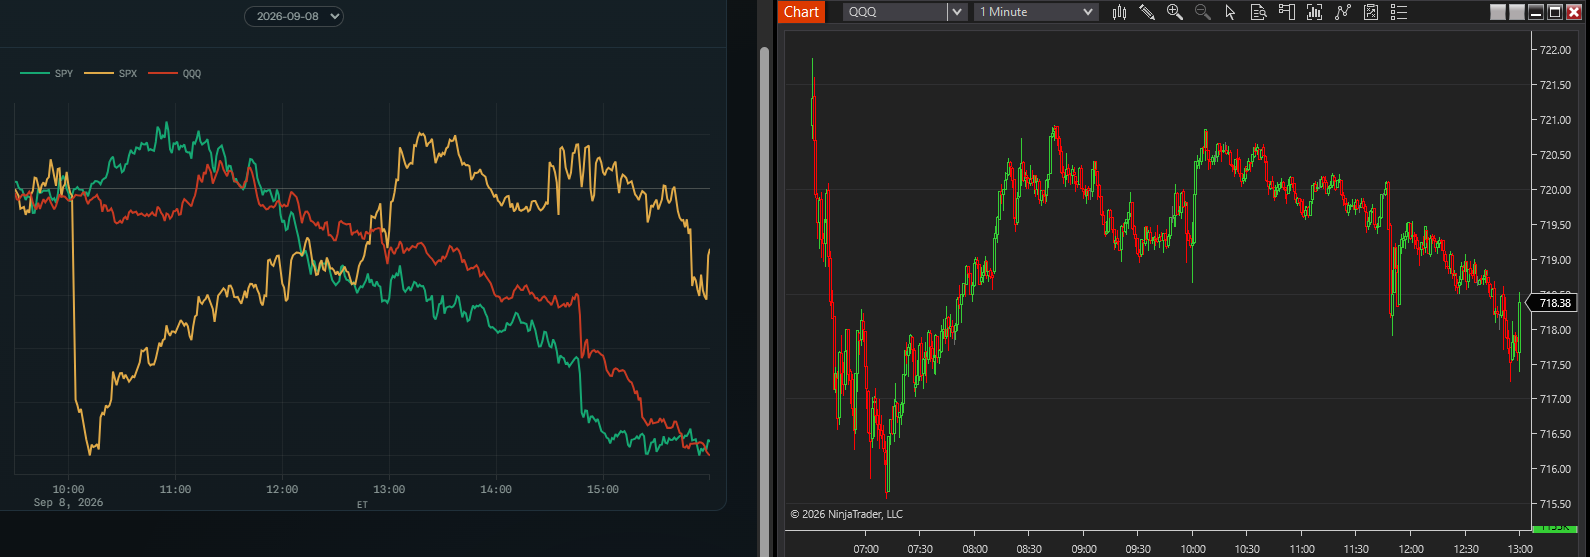
CVD can mean different things. On this site, futures cumulative delta refers to ES or NQ volume traded at the bid and ask. Options CVD refers to Amon Hen’s options-flow tool. Neither one is the Greek called delta.
We wanted an options-flow chart we could watch all day, much like cumulative delta in ES. We suggested the feature to HelmFi and helped improve it over several weeks. HelmFi built the tool and provides the data.
What goes into the calculation?
Amon Hen tracks SPX, SPY and QQQ contracts. Trades at the ask add to CVD. Trades at the bid subtract from it. Trades inside the spread are left out. The tool covers 11 strikes above and below at-the-money across the two nearest expirations, and it resets that range every 15 minutes. These settings may change while the tool is in beta.
A −17,000 reading does not mean only 17,000 contracts traded. It is the difference between the contracts counted at the ask and the bid. The chart also cannot tell whether a trade opened or closed a position.
Call CVD = cumulative ask-side calls − bid-side calls
Put CVD = cumulative ask-side puts − bid-side puts
Split: find out what actually moved
 amonhen.helmfi.ai
Open chart at full size ↗
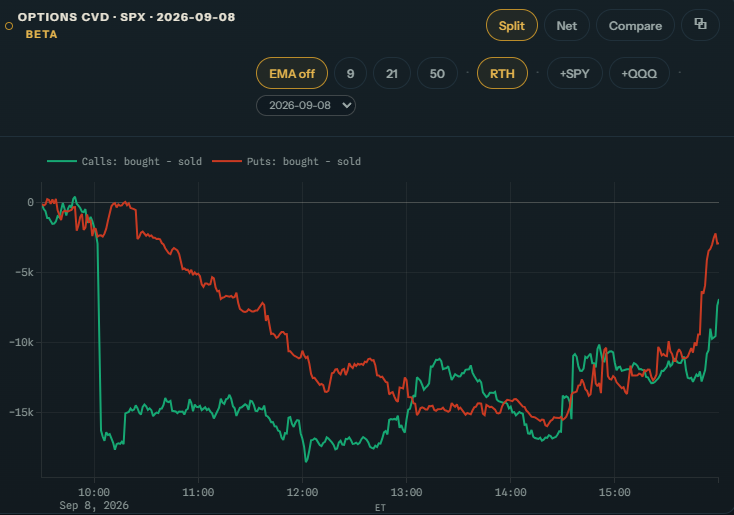
Split shows calls in green and puts in red. A falling green line means more calls traded at the bid. A rising red line means more puts traded at the ask. Both can push the Net reading lower, but for different reasons.
On September 8, the sudden move came mainly from calls. Put flow changed more slowly. Split makes that easy to see. It cannot tell us why the trades were made or prove that they moved the market.
Net: combine calls and puts directionally
 amonhen.helmfi.ai
Open chart at full size ↗
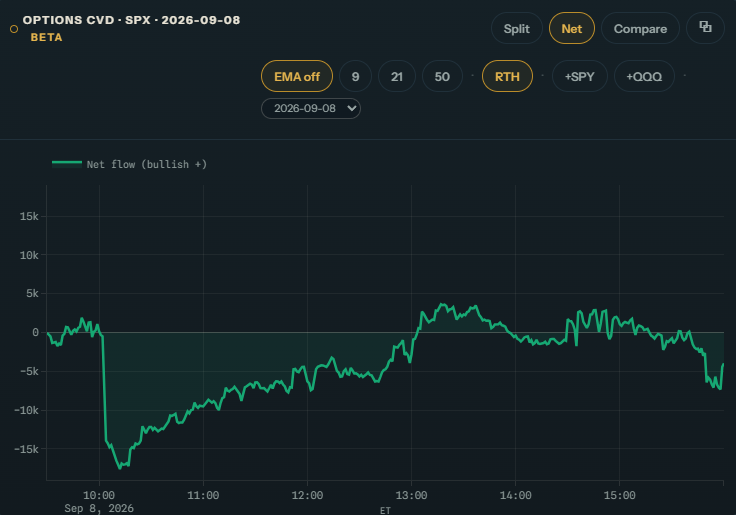
Net combines calls and puts into one line. Call buying and put selling move it up. Call selling and put buying move it down.
When Net moves, check Split to see why. Calls, puts, or both may be driving the change. Also notice whether Net is above or below zero.
Net options CVD = Call CVD − Put CVD
Compare: look for disagreement
Compare puts SPY, SPX and QQQ on one chart. Each line is scaled to its own range, so compare the shapes and turns. Do not compare the lines as raw contract totals.
We look for one index to suddenly break away from the others. It may snap back, or the other indexes may follow. The split gets our attention. What price and flow do next matters more.
Shade shows whether the three lines are on the same side of their own 50-period EMA. It does not show whether total flow is positive or negative. A clean flip also needs ten minutes of confirmation, so the label appears after the move begins.
How we read a session
Start with the larger price picture. Then look at the shape of the day’s flow. If something looks unusual, open Split to see whether calls or puts caused it. Finally, watch how price reacts.
A sharp reversal after an extreme may mark a turning point. But the chart still needs to give us a usable entry and a clear place to admit the idea is wrong. We cannot assume we bought the exact low after seeing the finished chart.
What the chart cannot tell us
Amon Hen leaves out trades made inside the spread. It also cannot tell whether a trade opened or closed a position. On this SPX chart, 40% of the trades were excluded, so we should keep that number in view.
The strikes being tracked change as the market moves. When we compare two days, we also need to compare the expirations, session settings and version of the tool.
These are early examples viewed after the fact. They do not prove a fixed exhaustion level or a repeatable setup. We need many more sessions, including days when the same idea failed.
Sources & further reading
References support the calculations and platform descriptions. Interpretations and research questions are our own; chart studies do not establish tested performance.
Platform details reviewed September 9, 2026. Features may change.
Educational information only. Trading involves risk. Read the full disclaimer.