 amonhen.helmfi.ai
SEPTEMBER 9, 2026 · SPX OPTIONS / QQQ
SPX call selling ends. QQQ rebounds.
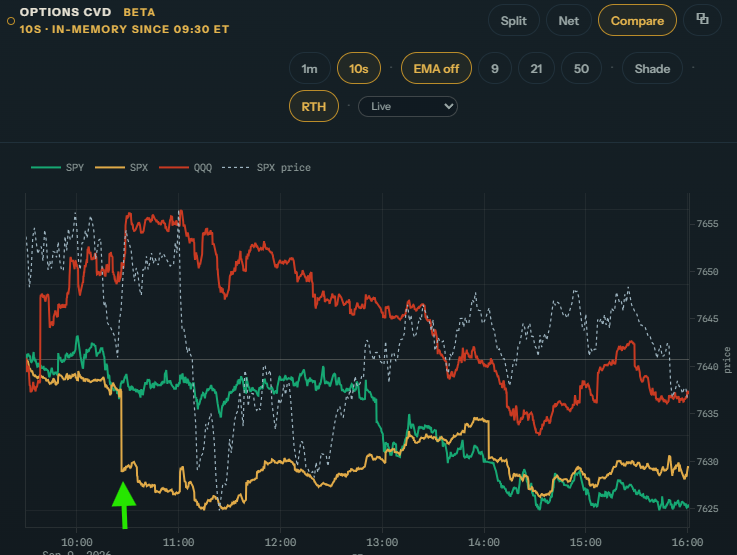
A familiar divergence: a burst of SPX call selling stands out from the other markets. After it stops, QQQ turns higher.
Read this session study →OPTIONS FLOW / FUTURES FLOW / PRICE RESPONSE
Price tells us what happened. We study the buying and selling underneath it—and whether price responds.
A trader’s perspective since 1997. Start with the introduction below.
 amonhen.helmfi.ai
The SPX flow line breaks away. QQQ then recovers from its morning low.
See how we read this session →Original trader capture · Amon Hen by HelmFi ↗ · Click the chart to enlarge.START HERE
Most technical indicators are calculated from price. Flow tools measure trading activity. They help us ask a different question: how much buying or selling is happening, and what is price doing in response?
You can learn the basics right here. The full guides are there when you want more detail.
01 / OPTIONS CVD
Amon Hen’s options CVD tracks buying and selling in calls and puts. We compare SPX, SPY and QQQ to spot unusually strong activity or a market moving differently from the others.
A sudden burst of SPX call selling, for example, gets our attention. What price does next tells us whether that pressure is still working.
Full guide: Options CVD →02 / FUTURES CUMULATIVE DELTA
Cumulative delta adds up volume traded at the ask minus volume traded at the bid. A rising line means more aggressive buying; a falling line means more aggressive selling.
If delta keeps rising but price barely moves, buyers are putting in a lot of effort without getting much back. That is worth watching.
Full guide: Futures cumulative delta →READ THE FLOW. WATCH THE RESPONSE.
Options flow shows one part of the activity. Futures cumulative delta shows another. We watch both beside price, looking for moments when the buying or selling stops getting results.
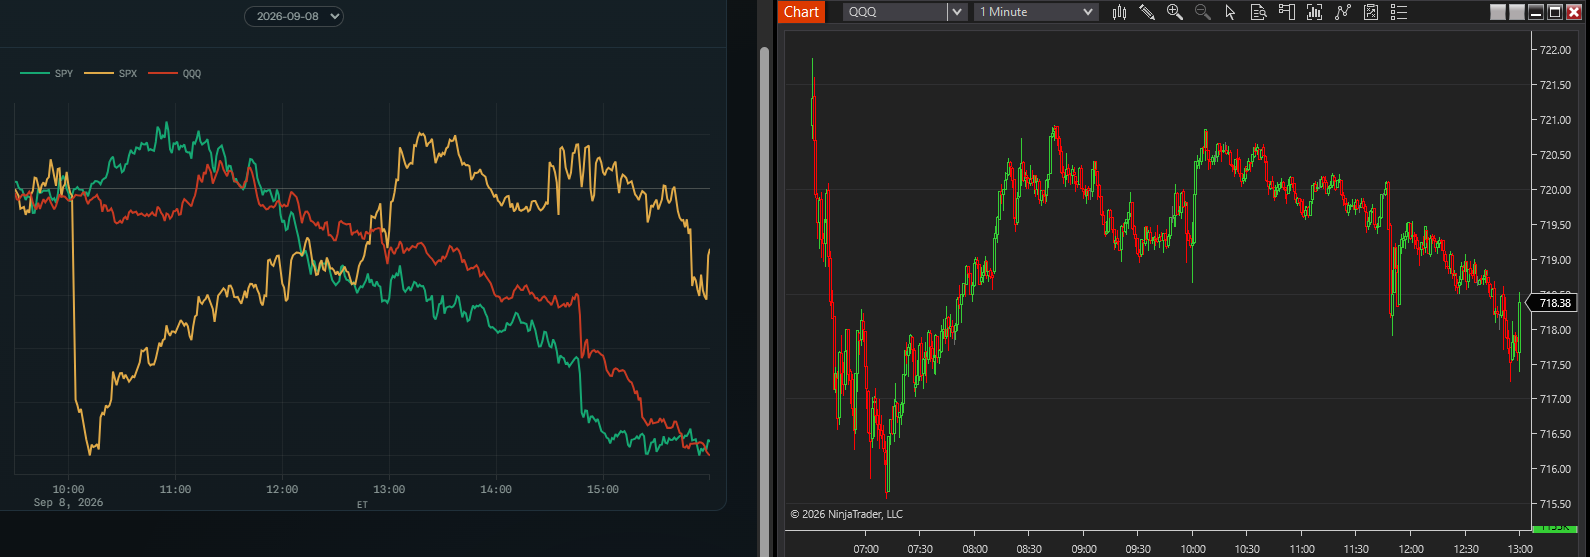
SPX options flow drops sharply while SPY and QQQ hold steadier. Price sells off, but then stops making progress lower. When the selling eases, price starts to recover.
That disagreement is a divergence. It gives us a reason to pay attention. The price response tells us what happens next.
The session studies below show how these situations played out on real charts.
REAL SESSION STUDIES
Each study is an article about a particular day: the flow clue, how price responded, the full price swing, and what we want to watch for again.
amonhen.helmfi.aiSEPTEMBER 9, 2026 · SPX OPTIONS / QQQ
A familiar divergence: a burst of SPX call selling stands out from the other markets. After it stops, QQQ turns higher.
Read this session study →READY TO READ MORE?
Find the full explanations of options CVD, futures cumulative delta, using the tools together, and Atlas dealer levels.