upunder the price.Search

Session studies · Session study

SPX call selling ends. QQQ rebounds.

Under the Price EditorialUpdated 2 min read
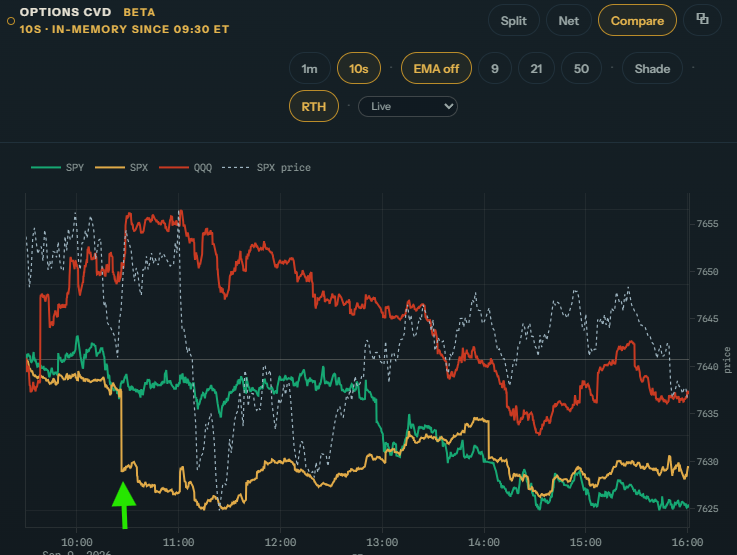
THE SHORT ANSWERSPX call flow fell sharply away from SPY and QQQ. Once that burst of call selling ended, QQQ immediately turned higher. This is the same divergence pattern we keep seeing.
MAXIMUM MOVE SHOWNAbout 2.40 QQQ points from the reaction low to the rebound high (0.34%).
Platform & relationship disclosure. Amon Hen is built by HelmFi ↗. We proposed and helped refine its options CVD feature. HelmFi compensated the trader behind Under the Price for an introductory video. That payment was for the video only; HelmFi is not paying for this website or its articles. Charts are used with permission; interpretations here are our own. Read the disclosure.

What stood out?

Amon Hen Compare chart showing SPX options flow dropping sharply away from SPY and QQQ on September 9, 2026.amonhen.helmfi.ai
Compare · September 9, 2026. SPX flow breaks sharply below SPY and QQQ. The green arrow marks the divergence. · Amon Hen by HelmFi ↗
Open chart at full size ↗

The yellow SPX line suddenly dropped while SPY and QQQ flow held much steadier. That clean separation was the main setup of the day.

The move happened near the 7630 put wall shown on the Split chart, giving the divergence a clear location.

What happened next?
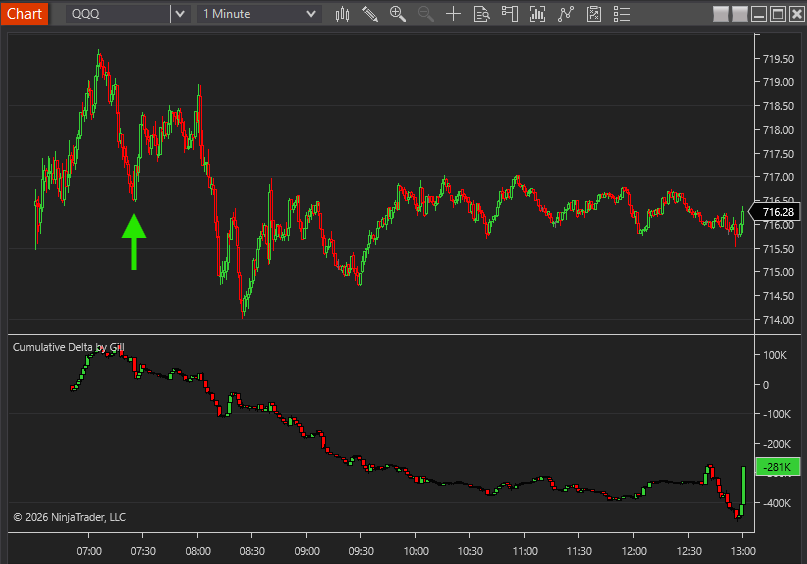
QQQ one-minute chart showing price rebounding while cumulative delta remains deeply negative on September 9, 2026.
QQQ and futures cumulative delta · September 9, 2026. QQQ turns higher as the SPX call-selling burst ends.
Open chart at full size ↗

QQQ made a low as the SPX call selling ended and then bounced immediately. Price recovered even though regular cumulative delta remained deeply negative.

The market was no longer following the selling pressure lower. That was the price response we wanted to see.

Why was it interesting?
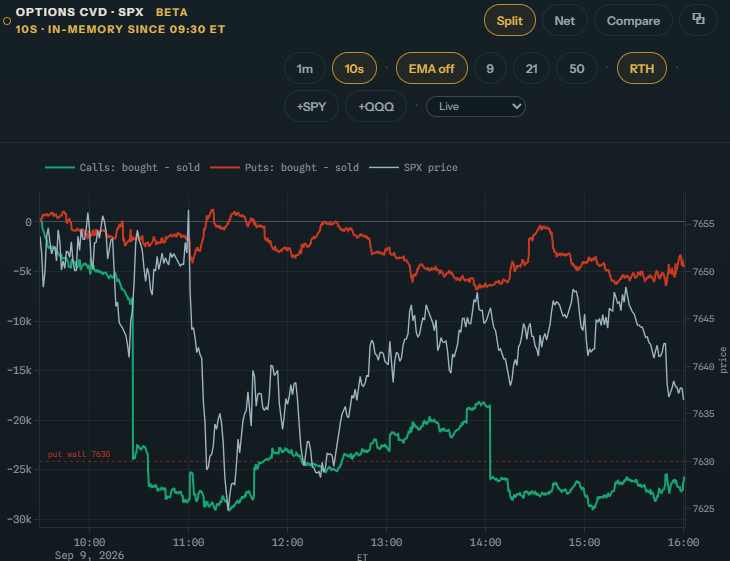
Amon Hen Split chart showing SPX call CVD dropping sharply while put CVD changes less on September 9, 2026.amonhen.helmfi.ai
Split · September 9, 2026. The green call line creates most of the sudden move while put flow remains steadier. · Amon Hen by HelmFi ↗
Open chart at full size ↗

Split confirms that calls drove the sudden SPX move. Put flow changed much less during the break.

We have now seen this sequence more than once: SPX call selling breaks away from the other indexes, the selling stops, and the market rebounds.

What should we watch next time?

First, look for one line in Compare to break sharply away. Then use Split to see whether calls or puts caused it. Finally, watch whether price stops following the flow and begins to turn.

We will keep saving these examples to learn how the size, speed and location of the divergence affect the rebound.

SPX calls sold → SPX separates from SPY and QQQ → selling stops → QQQ turns higher
About the perspective

Under the Price brings a trading perspective dating to 1997 to futures cumulative delta, options flow and the process of studying unusual market behavior. We explain the observation, its possible interpretation and the evidence still needed.

How we approach evidence and editorial review →

Educational information only. Trading involves risk. Read the full disclaimer.