upunder the price.Search

Session studies · Session study

SPY CVD gives the clue. QQQ gives the stronger rebound.

Under the Price EditorialUpdated 2 min read
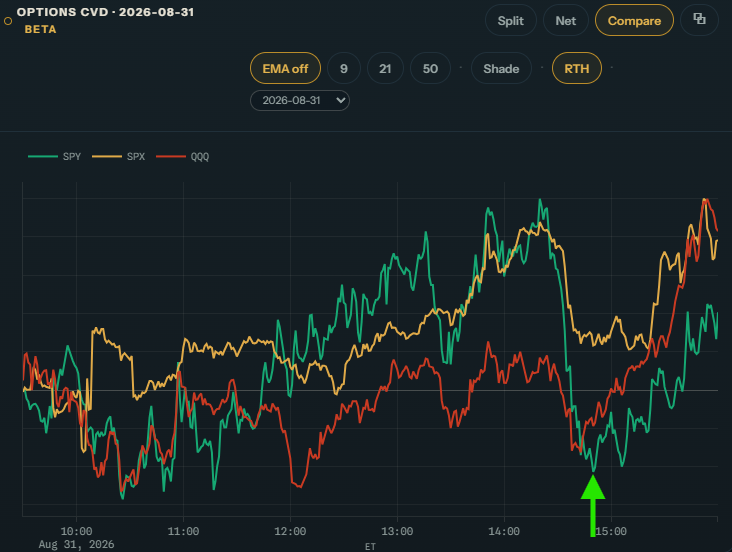
THE SHORT ANSWERSPY CVD was the main clue: its line pushed to a sharp afternoon low while SPX held well above its own earlier low. QQQ and ES then rebounded, with QQQ making the larger percentage move.
MAXIMUM MOVE SHOWNQQQ: about 3.60 points (0.50%). ES: about 28.50 points (0.37%). QQQ’s percentage move was about 36% larger.
Platform & relationship disclosure. Amon Hen is built by HelmFi ↗. We proposed and helped refine its options CVD feature. HelmFi compensated the trader behind Under the Price for an introductory video. That payment was for the video only; HelmFi is not paying for this website or its articles. Charts are used with permission; interpretations here are our own. Read the disclosure.

What stood out?

Amon Hen Compare chart marking an afternoon options-flow low on August 31, 2026.amonhen.helmfi.ai
Compare · August 31, 2026. The green arrow marks the SPY CVD low that drew our attention before the rebound. · Amon Hen by HelmFi ↗
Open chart at full size ↗

The green SPY CVD line was the main clue. It dropped to a fresh afternoon low while SPX CVD held above its earlier low. That divergence stood out as QQQ and ES reached their afternoon price lows.

QQQ’s cumulative delta had been rising through much of the day. The afternoon price pullback gave us another reason to watch how price responded when selling eased.

What happened next?
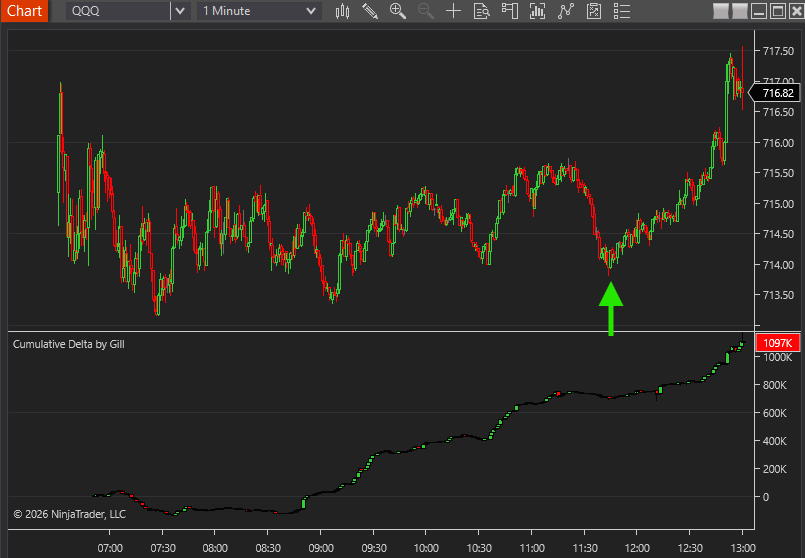
QQQ price and cumulative delta showing an afternoon low followed by a rebound on August 31, 2026.
QQQ · August 31, 2026. The largest rebound shown is about 3.60 points, or 0.50%.
Open chart at full size ↗

QQQ rose from roughly 713.95 to 717.55. ES rose from roughly 7,677.50 to 7,706.00.

Both rebounds were tradable, but QQQ gained about 0.50% while ES gained about 0.37%.

Why was it interesting?
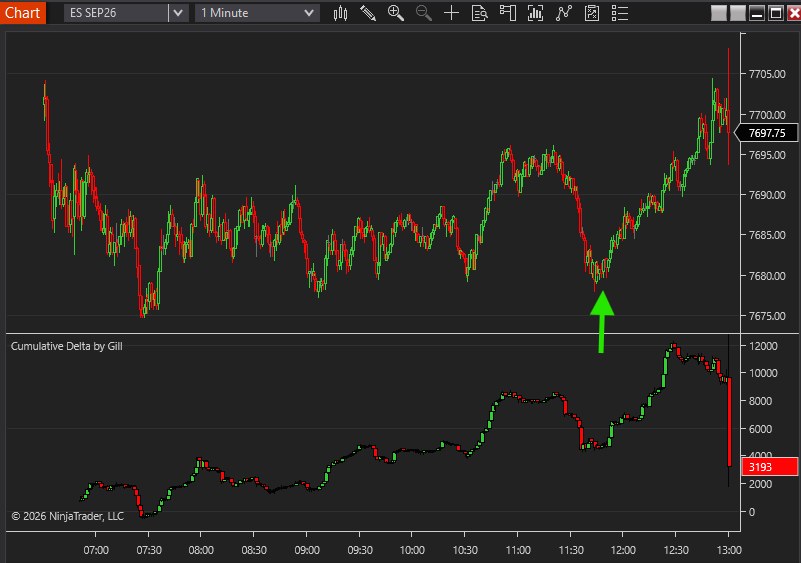
ES price and cumulative delta showing an afternoon low followed by a rebound on August 31, 2026.
ES · August 31, 2026. The largest rebound shown is about 28.50 points, or 0.37%.
Open chart at full size ↗

SPY supplied the options-flow clue, while QQQ delivered the larger price response: about 36% more movement than ES on a percentage basis.

The market providing the clue does not have to be the one we trade. Here, the SPY divergence led us to compare the rebound in QQQ and ES.

What should we watch next time?

When a bullish divergence appears, compare the reaction in QQQ and ES before choosing the trade. The market with the stronger response may offer more room.

We will keep recording both moves to see whether QQQ continues to outperform in this setup.

About the perspective

Under the Price brings a trading perspective dating to 1997 to futures cumulative delta, options flow and the process of studying unusual market behavior. We explain the observation, its possible interpretation and the evidence still needed.

How we approach evidence and editorial review →

Educational information only. Trading involves risk. Read the full disclaimer.