What stood out?
 amonhen.helmfi.ai
Open chart at full size ↗
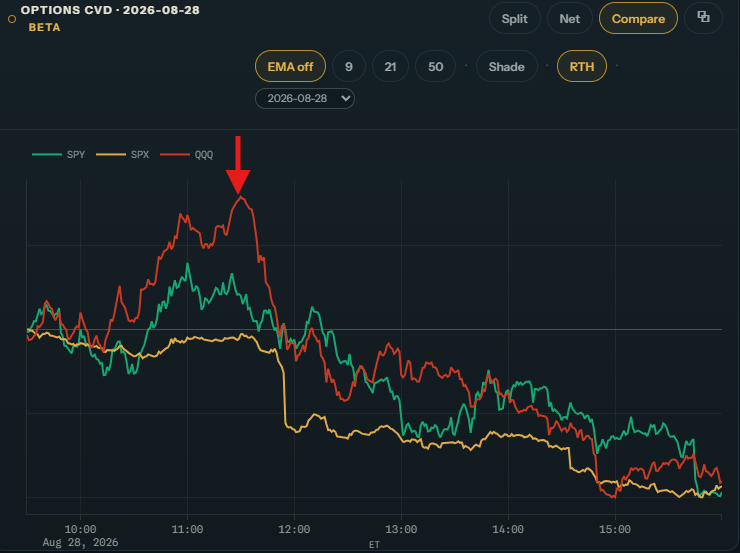
QQQ options CVD made a higher high, but ES could not get above its earlier morning high. More options-flow strength was producing less price progress: a bearish divergence.
The second test of the ES high gave that divergence a clear location. We watched for the buying pressure to fade and price to turn down.
What happened next?
Open chart at full size ↗
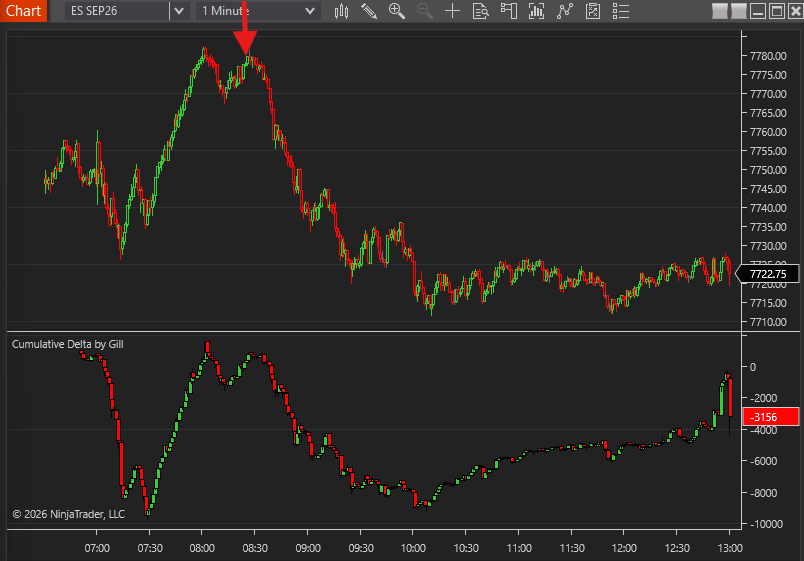
QQQ options flow reversed sharply. ES turned down at the same time and futures cumulative delta moved from positive to negative.
ES fell roughly 68 points from the morning high to the later session low.
Why was it interesting?
The divergence showed that the stronger QQQ options reading was not translating into a higher ES price. Falling futures cumulative delta then showed selling taking over.
The two tools told the story in order: a bearish divergence near the high, followed by futures selling and a sustained price decline.
What should we watch next time?
Watch for one index to separate sharply in Compare while price tests an earlier high. If that line turns down and futures cumulative delta follows, the reversal may have room to continue.
The second test of a high may be especially useful because it gives the options-flow extreme a clear price location.
Educational information only. Trading involves risk. Read the full disclaimer.